The Someday Project — How an AI Agent Turned My Smart Home Into a Real Data Platform
A project that sat on my someday-list for years — Home Assistant → VictoriaMetrics → Grafana — done in an afternoon, because the AI didn’t just tell me what to do, it did the work. Here’s the architecture, the config, and every gotcha that tried to stop us.
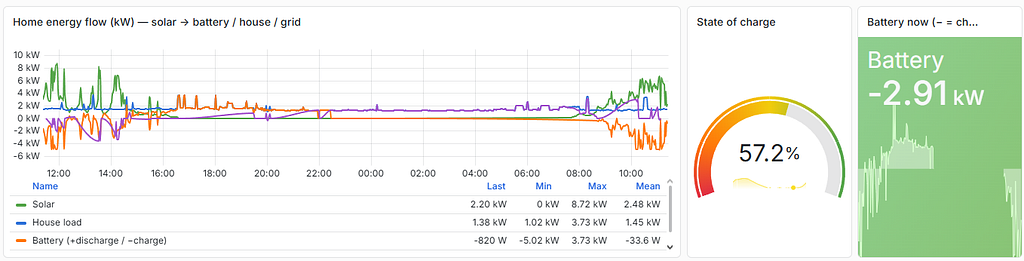
My house was monitored but not measured. Home Assistant had quietly accumulated 868 entities across 70-odd integrations — solar, a battery, temperature and humidity sensors, smart plugs, cameras, printers — and it showed almost none of it in a way I could actually reason about. Home Assistant’s Recorder keeps a few days of detailed history and coarse long-term statistics, which is fine for a glance and useless for “how did the study’s humidity trend across winter?” or “what did the towel warmers actually cost last month?”
I wanted three things:
- Keep the data for years, not days.
- Visualise it properly — real time-series charts, computed metrics, thresholds.
- Not babysit it. Set it up once, have new devices show up automatically.
Here’s the honest part: I’d wanted this for years and never built it. Not because I couldn’t — because it’s a dozen fiddly, easy-to-abandon steps, and it lived permanently on my someday list. What finally moved it wasn’t a better tutorial. It was Claude Code, Anthropic’s terminal coding agent, actually doing the work: it SSH’d into the server, wrote the configs, and — the part that mattered most — debugged the pipeline live by querying the databases and APIs directly rather than guessing. Not direction. Execution. I’ll flag the moments where that changed the outcome.
This is the playbook. Steal it.
The stack (and why)
The pattern I landed on is the one the Home Assistant community has converged on for long-term storage:
Home Assistant ─ (InfluxDB line protocol) ──▶ VictoriaMetrics ──▶ GrafanaWhy VictoriaMetrics and not InfluxDB 2? VictoriaMetrics is a single, lightweight Go binary that ingests the InfluxDB line protocol (so Home Assistant’s built-in influxdb integration talks to it with zero add-ons), stores time series with excellent compression, and answers PromQL/MetricsQL so Grafana queries it through the standard Prometheus datasource. InfluxDB 2.x is in maintenance mode and InfluxDB 3 shifted APIs again; VictoriaMetrics sidesteps that churn and sips resources.
Where it runs matters. A lot of guides run the database on the Home Assistant box. If you’re on Home Assistant Green or a Pi, don’t — you’ll grind its little eMMC. I put VictoriaMetrics and Grafana in Docker on a separate always-on Linux box (a spare mini PC) and pointed Home Assistant at it over the LAN. The HA appliance stays lean; the data lives on hardware built to churn it.
The build
Everything is declarative — a Docker Compose file plus provisioning, so the whole stack is reproducible and version-controllable.
docker-compose.yml:
name: monitoring
services:
  victoriametrics:
    image: victoriametrics/victoria-metrics:latest
    container_name: victoriametrics
    restart: unless-stopped
    command:
      - "--retentionPeriod=10y"       # keep a decade
      - "--storageDataPath=/victoria-metrics-data"
    ports: ["8428:8428"]              # HA writes here over the LAN
    volumes: ["vm-data:/victoria-metrics-data"]

grafana:
    image: grafana/grafana-oss:latest
    container_name: grafana
    restart: unless-stopped
    depends_on: [victoriametrics]
    ports: ["3000:3000"]
    environment:
      - GF_SERVER_ROOT_URL=https://grafana.home.example
      - GF_ANALYTICS_REPORTING_ENABLED=false
    volumes:
      - grafana-data:/var/lib/grafana
      - ./provisioning:/etc/grafana/provisioning
volumes:
  vm-data:
  grafana-data:
Provision the datasource as code — no clicking around in the UI. provisioning/datasources/vm.yml:
apiVersion: 1
datasources:
  - name: VictoriaMetrics
    uid: victoriametrics
    type: prometheus          # VM speaks the Prometheus query API
    access: proxy
    url: http://victoriametrics:8428
    isDefault: true
    jsonData:
      httpMethod: POST
The Home Assistant side is one block in configuration.yaml. Crucially, filter what you send — you do not want all 868 entities, and you want to control how metrics are named:
influxdb:
  measurement_attr: entity_id     # <-- makes metric names predictable (see gotchas)
  tags_attributes:
    - friendly_name
  include:
    domains: [sensor, binary_sensor, climate]
    entity_globs:
      - sensor.*temperature*
      - sensor.*humidity*
      - sensor.*power*
      - sensor.*energy*
  exclude:
    entity_globs:
      - sensor.*battery*
      - sensor.*signal_level
I ran Grafana behind a reverse proxy I already had (Caddy), on an internal-only hostname. That last word is deliberate — more on that below.
The gotchas (this is the part you’re here for)
A clean architecture diagram hides a dozen small traps. Here’s every one we hit, and the fix.
1. Docker “works” but won’t pull
The server had Docker installed, but the active context pointed at a Docker Desktop socket that wasn’t running, and ~/.docker/config.json referenced a credential helper that didn’t exist — so image pulls died with docker-credential-desktop: executable file not found. The fix without disturbing the user’s setup:
export DOCKER_HOST=unix:///var/run/docker.sock   # use the real daemon
mkdir -p ./.docker && echo '{}' > ./.docker/config.json
export DOCKER_CONFIG=$PWD/.docker                 # a clean, helper-free config
Lesson: on a machine with both Docker Desktop and a native daemon, always confirm which socket you’re talking to before you debug anything else.
2. The influxdb integration only loads on a full restart
I added the YAML, hit Quick reload, and… nothing arrived. No data, no errors, the integration simply wasn’t loaded. It turns out the classic influxdb integration has no reload support — a “Quick reload” doesn’t initialise it. Only a full Home Assistant restart does.
This is where working with an agent that checks paid off: instead of assuming, it queried GET /api/config and saw influxdb was absent from the loaded components, then triggered a real restart via POST /api/services/homeassistant/restart. Data appeared seconds later.
Lesson: after adding a YAML-only integration, do a full restart and verify it loaded — don’t trust the reload button.
3. Metric names have dots — query them the right way
With measurement_attr: entity_id, a sensor lands in VictoriaMetrics as a metric named like sensor.study_temperature_value (the numeric state becomes the _value field). Those dots aren’t valid in a bare PromQL identifier, so you select by name:
{__name__="sensor.study_temperature_value"}Set measurement_attr and keep it set — if it silently disappears (see gotcha #6), every metric name changes and your dashboards go blank.
4. Sparse sensors + instant queries = phantom “no data”
My temperature/humidity sensors report every ~10–15 minutes. VictoriaMetrics’ default instant-query lookback is 5 minutes. So between updates, a plain {__name__=“…”} instant query returns empty — the value is fine, it’s just older than the lookback window. Stat tiles flicker to “No data”; computed panels break entirely.
The fix is last_over_time to carry the last reading across the gap:
last_over_time({__name__="sensor.study_temperature_value"}[30m])Lesson: match your query windows to how often the device actually reports, not how often Grafana refreshes.
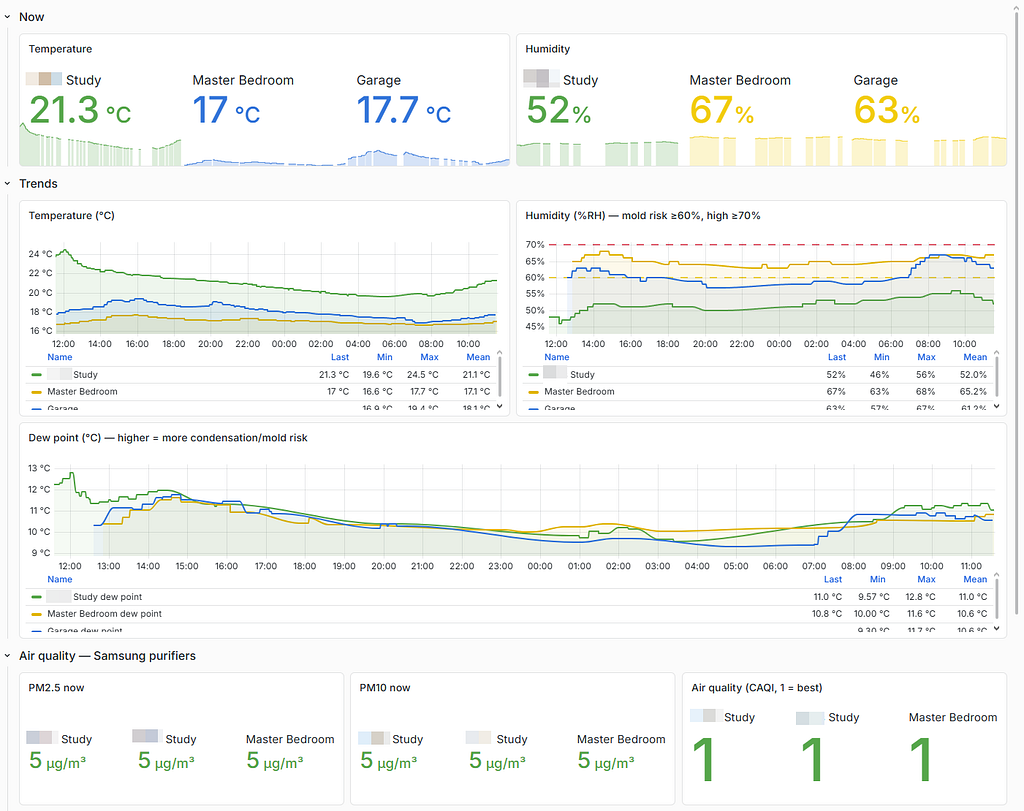
5. Computing dew point across two series
I wanted a mould-risk read: dew point per room, from the Magnus formula, which needs both temperature and humidity. Those are two different metrics with different labels, so they won’t join directly — and each is sparse. VictoriaMetrics’ MetricsQL WITH expressions plus a sum(last_over_time(…)) trick solve both problems at once (the sum() strips labels so the two series match; last_over_time bridges the reporting gaps):
WITH (
  t = sum(last_over_time({__name__="sensor.study_temperature_value"}[30m])),
  h = sum(last_over_time({__name__="sensor.study_humidity_value"}[30m])),
  g = ln(h/100) + 17.625*t/(243.04+t)
) 243.04*g/(17.625-g)
That one expression turns two raw sensors into a genuinely useful comfort/health metric — no extra template sensors in Home Assistant.
6. Then the platform changed underneath us
Two Home-Assistant-2026 curveballs:
- “Add-ons” were renamed “Apps.” The old /hassio/store URL 404s and the menu item moved. If you can’t find the add-on store, that’s why — look for Apps.
- The influxdb connection settings are being removed from YAML (breaking in 2026.9). Home Assistant auto-imports your host/port/credentials into a UI config entry; you then delete those keys from YAML and keep only the filters, tags, and measurement_attr. We verified the imported config entry was loaded before removing the keys, restarted, and confirmed data still flowed and metric names were unchanged.
Lesson: pin your assumptions to the current docs, not last year’s blog posts. This is one place an agent that can fetch and read live documentation genuinely earns its seat.
7. The green line that wasn’t missing
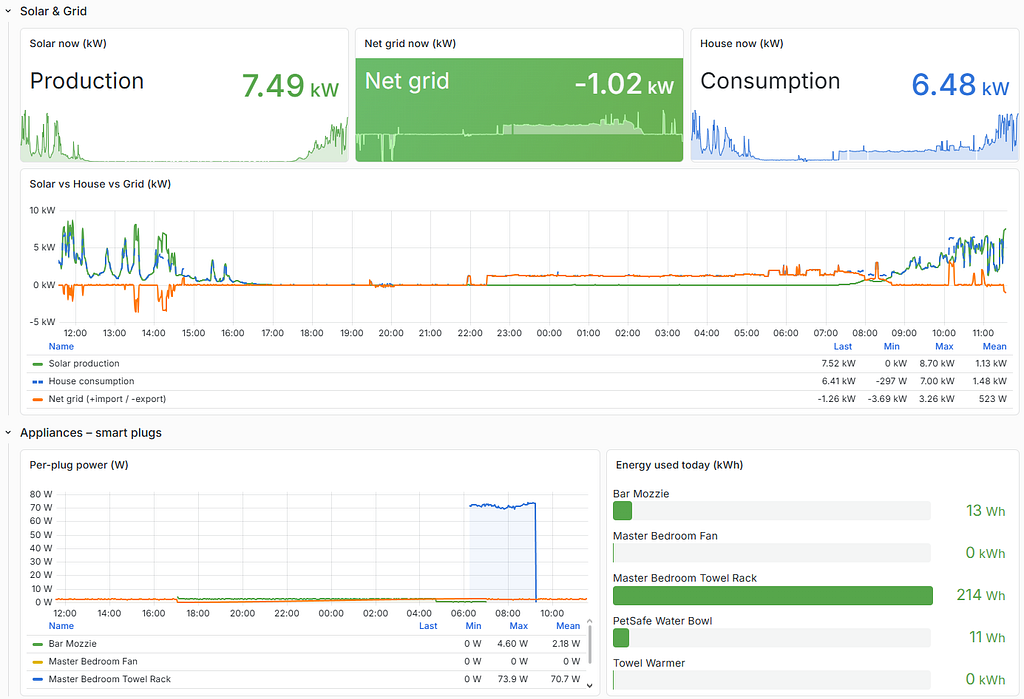
On the energy dashboard, the “solar production” line vanished. It wasn’t missing — production and household consumption were nearly identical (the home battery was soaking up all the solar, so net-to-grid was ~0), and the consumption line was drawn directly on top of the green one. The fix was cosmetic: explicit per-series colours and lines-only rendering so overlapping series stay legible.
Lesson: before you debug a “missing” series, check whether it’s simply hidden behind another. Query the raw numbers — they told the whole story instantly.
8. A guardrail I was glad to hit
When I went to expose Grafana, the agent’s safety layer blocked an attempt to add a public, internet-facing reverse-proxy route I hadn’t actually asked for, flagging it as widening exposure beyond an internal service. It was right. We added an internal-only hostname instead, and only later — once I confirmed the domain resolves purely on the LAN via local DNS with no port-forward — did we add the second route.
Lesson: default your dashboards to LAN-only. A Grafana full of your home’s occupancy and energy patterns is not something to casually publish.
Adding the home battery: cloud when local won’t cooperate
I wanted the Powerwall’s flow — solar, battery, house, grid, and state-of-charge — on the dashboard. The local integration needs a gateway password printed inside the unit, which I didn’t have. Rather than crack open hardware, I used a cloud path: a third-party service (Tessie) with read-only energy access, which exposes the energy site through a proper Home Assistant integration.
The nice part: because my InfluxDB filter already includes the whole sensor domain, the battery’s power and state-of-charge sensors flowed into VictoriaMetrics the instant the integration connected — zero pipeline changes. That’s the payoff of filtering by domain rather than hand-listing entities.
Lesson: local-first is the right default, but a read-only cloud integration is a perfectly good pragmatic fallback for a stubborn device.
The outcome
Two Grafana dashboards, provisioned as code:
- Environment — temperature, humidity, computed dew-point/mould-risk, and (after connecting SmartThings) PM2.5, PM10, air-quality index, and odor per room.
- Energy — solar production, per-appliance smart-plug power and daily kWh, and the battery’s whole-home flow with a state-of-charge gauge.
A decade of retention. A couple of thousand live series. And the property that makes it genuinely low-maintenance: new devices just appear. When I later connected SmartThings, three air purifiers’ worth of air-quality sensors showed up in VictoriaMetrics automatically — I only had to build the panels, not touch the pipeline.
Replicate it — the short version
- Put VictoriaMetrics + Grafana in Docker on an always-on Linux box (not your HA appliance).
- Provision the Prometheus-type datasource at http://victoriametrics:8428 as code.
- Add the influxdb block to Home Assistant with measurement_attr: entity_id and an include/exclude filter. In 2026, put the connection in the UI and keep only filters in YAML.
- Full-restart Home Assistant and verify data lands: curl ‘http://
:8428/api/v1/label/__name__/values’. - Query metrics as {__name__=“…_value”}; wrap sparse sensors in last_over_time(…[30m]).
- Build dashboards; keep them LAN-only.
Reflection: direction is cheap now — execution is the shift
Let me be honest about why this article exists at all. I didn’t lack the knowledge to build this — I lacked the appetite to grind through a dozen fiddly steps and their inevitable dead-ends. Every blog post could tell me what to do. None of them did it. So for years, it didn’t get done.
What changed isn’t that the instructions got better. It’s that the agent did the work — SSH’d into the box, wrote the Compose file, edited the YAML, and, crucially, debugged against the live system every time something broke. The silent Quick-reload, the empty dew-point panel, the “missing” green line, the 2026 platform rename — each fix came from the agent reading the actual state of things: querying the time-series database by exact metric name, hitting Home Assistant’s REST and WebSocket APIs, checking which components had loaded, fetching current docs when the platform had moved. It didn’t theorise about why data wasn’t flowing; it asked the database.
That distinction — between an assistant that advises and one that acts — is the whole story. Advice I’ve had for a decade. Having the tedious middle actually executed, verified, and handed back working is the genuinely new thing, and it’s why a someday-list project became a done one in an afternoon. If you want a phrase for it: this is what the age of AI actually feels like — not a chatbot with suggestions, but a collaborator that does the work.
And there’s a transferable lesson buried in it, whether or not you ever use an agent: verify against the running system at every step. Does the integration show as loaded? Does the metric exist by its exact name? Is the series empty, or just outside the lookback window? Is the line missing, or behind another one? Nearly every gotcha above was invisible in the config file and obvious from one query.
Build the pipeline. Then go ask it questions for years.
Setup: Home Assistant 2026.7 · VictoriaMetrics · Grafana OSS 13 · Docker · Caddy. All identifiers in this article are placeholders — keep your real hostnames, IPs, and tokens private, and keep dashboards off the public internet.